


District 3, DeSoto County, Mississippi
About
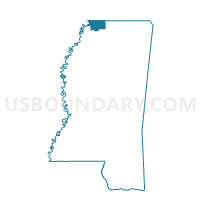
Outline

Summary
| Unique Area Identifier | 138765 |
| Name | District 3 |
| County | DeSoto County |
| State | Mississippi |
| Area (square miles) | 98.23 |
| Land Area (square miles) | 90.00 |
| Water Area (square miles) | 8.23 |
| % of Land Area | 91.62 |
| % of Water Area | 8.38 |
| Latitude of the Internal Point | 34.94634060 |
| Longtitude of the Internal Point | -90.17392680 |
| Total Population | 27,008 |
| Total Housing Units | 10,048 |
| Total Households | 9,331 |
| Median Age | 31.3 |
Maps

Graphs
Select a template below for downloading or customizing gragh for District 3, DeSoto County, Mississippi


Neighbors
Neighoring County Subdivision (by Name) Neighboring County Subdivision on the Map
- District 1, Tunica County, MS
- District 2, Shelby County, TN
- District 2, DeSoto County, MS
- District 3, Shelby County, TN
- District 4, DeSoto County, MS
- Lucas township, Crittenden County, AR
Top 10 Neighboring Place (by Population) Neighboring Place on the Map
- Memphis city, TN (646,889)
- Southaven city, MS (48,982)
- Horn Lake city, MS (26,066)
- Lynchburg CDP, MS (2,437)
- Tunica Resorts CDP, MS (1,910)
- Walls town, MS (1,162)
Top 10 Neighboring Unified School District (by Population) Neighboring Unified School District on the Map
- Memphis City School District, TN (646,889)
- Shelby County School District, TN (280,755)
- DeSoto County School District, MS (161,252)
- Tunica County School District, MS (10,778)
- Hughes School District, AR (3,154)
Top 10 Neighboring State Legislative District Lower Chamber (by Population) Neighboring State Legislative District Lower Chamber on the Map
- State House District 85, TN (67,989)
- State House District 86, TN (54,462)
- State House District 40, MS (32,431)
- State House District 7, MS (30,501)
- State House District 25, MS (29,000)
- State House District 54, AR (21,956)
Top 10 Neighboring State Legislative District Upper Chamber (by Population) Neighboring State Legislative District Upper Chamber on the Map
- State Senate District 33, TN (179,193)
- State Senate District 19, MS (82,994)
- State Senate District 1, MS (78,258)
- State Senate District 16, AR (68,732)
- State Senate District 11, MS (48,319)
Top 10 Neighboring 111th Congressional District (by Population) Neighboring 111th Congressional District on the Map
- Congressional District 1, MS (788,095)
- Congressional District 1, AR (687,694)
- Congressional District 2, MS (668,263)
- Congressional District 9, TN (610,823)
Top 10 Neighboring Census Tract (by Population) Neighboring Census Tract on the Map
- Census Tract 227, Shelby County, TN (7,166)
- Census Tract 702.10, DeSoto County, MS (6,453)
- Census Tract 9501, Tunica County, MS (6,044)
- Census Tract 224.10, Shelby County, TN (6,011)
- Census Tract 221.30, Shelby County, TN (5,920)
- Census Tract 703.23, DeSoto County, MS (5,362)
- Census Tract 306, Crittenden County, AR (4,875)
- Census Tract 703.24, DeSoto County, MS (4,834)
- Census Tract 222.10, Shelby County, TN (4,615)
- Census Tract 704.12, DeSoto County, MS (4,492)
Top 10 Neighboring 5-Digit ZIP Code Tabulation Area (by Population) Neighboring 5-Digit ZIP Code Tabulation Area on the Map
- 38109, TN (46,594)
- 38116, TN (40,404)
- 38671, MS (35,712)
- 38637, MS (26,066)
- 38632, MS (24,377)
- 38651, MS (7,103)
- 38680, MS (6,194)
- 38664, MS (3,279)
- 72348, AR (2,594)
- 38641, MS (2,338)
Data
Demographic, Population, Households, and Housing Units
** Data sources from census 2010 **
Show Data on Map
Download Full List as CSV
Download Quick Sheet as CSV
| Subject | This Area | DeSoto County | Mississippi | National |
|---|---|---|---|---|
| POPULATION | ||||
| Total Population Map | 27,008 | 161,252 | 2,967,297 | 308,745,538 |
| POPULATION, HISPANIC OR LATINO ORIGIN | ||||
| Not Hispanic or Latino Map | 24,806 | 153,166 | 2,885,816 | 258,267,944 |
| Hispanic or Latino Map | 2,202 | 8,086 | 81,481 | 50,477,594 |
| POPULATION, RACE | ||||
| White alone Map | 16,222 | 116,440 | 1,754,684 | 223,553,265 |
| Black or African American alone Map | 8,614 | 35,266 | 1,098,385 | 38,929,319 |
| American Indian and Alaska Native alone Map | 96 | 432 | 15,030 | 2,932,248 |
| Asian alone Map | 274 | 2,033 | 25,742 | 14,674,252 |
| Native Hawaiian and Other Pacific Islander alone Map | 11 | 86 | 1,187 | 540,013 |
| Some Other Race alone Map | 1,151 | 4,449 | 38,162 | 19,107,368 |
| Two or More Races Map | 640 | 2,546 | 34,107 | 9,009,073 |
| POPULATION, SEX | ||||
| Male Map | 13,203 | 78,595 | 1,441,240 | 151,781,326 |
| Female Map | 13,805 | 82,657 | 1,526,057 | 156,964,212 |
| POPULATION, AGE (18 YEARS) | ||||
| 18 years and over Map | 18,576 | 115,627 | 2,211,742 | 234,564,071 |
| Under 18 years | 8,432 | 45,625 | 755,555 | 74,181,467 |
| POPULATION, AGE | ||||
| Under 5 years | 2,261 | 11,599 | 210,956 | 20,201,362 |
| 5 to 9 years | 2,254 | 12,666 | 205,672 | 20,348,657 |
| 10 to 14 years | 2,458 | 13,544 | 208,248 | 20,677,194 |
| 15 to 17 years | 1,459 | 7,816 | 130,679 | 12,954,254 |
| 18 and 19 years | 768 | 4,153 | 93,940 | 9,086,089 |
| 20 years | 363 | 1,783 | 45,798 | 4,519,129 |
| 21 years | 309 | 1,767 | 43,475 | 4,354,294 |
| 22 to 24 years | 1,052 | 5,315 | 121,621 | 12,712,576 |
| 25 to 29 years | 2,002 | 10,276 | 199,082 | 21,101,849 |
| 30 to 34 years | 2,174 | 11,708 | 188,171 | 19,962,099 |
| 35 to 39 years | 2,262 | 12,912 | 187,368 | 20,179,642 |
| 40 to 44 years | 1,922 | 12,118 | 187,579 | 20,890,964 |
| 45 to 49 years | 1,922 | 12,171 | 208,369 | 22,708,591 |
| 50 to 54 years | 1,555 | 10,452 | 208,607 | 22,298,125 |
| 55 to 59 years | 1,216 | 8,834 | 186,569 | 19,664,805 |
| 60 and 61 years | 445 | 3,210 | 67,854 | 7,113,727 |
| 62 to 64 years | 583 | 4,587 | 92,902 | 9,704,197 |
| 65 and 66 years | 323 | 2,446 | 51,319 | 5,319,902 |
| 67 to 69 years | 423 | 3,321 | 69,204 | 7,115,361 |
| 70 to 74 years | 518 | 4,158 | 93,946 | 9,278,166 |
| 75 to 79 years | 349 | 2,908 | 69,876 | 7,317,795 |
| 80 to 84 years | 219 | 1,993 | 51,703 | 5,743,327 |
| 85 years and over | 171 | 1,515 | 44,359 | 5,493,433 |
| MEDIAN AGE BY SEX | ||||
| Both sexes Map | 31.30 | 35.00 | 36.00 | 37.20 |
| Male Map | 30.10 | 33.90 | 34.50 | 35.80 |
| Female Map | 32.40 | 36.00 | 37.50 | 38.50 |
| HOUSEHOLDS | ||||
| Total Households Map | 9,331 | 57,748 | 1,115,768 | 116,716,292 |
| HOUSEHOLDS, HOUSEHOLD TYPE | ||||
| Family households: Map | 6,982 | 43,830 | 770,266 | 77,538,296 |
| Husband-wife family Map | 4,448 | 32,121 | 506,633 | 56,510,377 |
| Other family: Map | 2,534 | 11,709 | 263,633 | 21,027,919 |
| Male householder, no wife present Map | 642 | 3,016 | 57,661 | 5,777,570 |
| Female householder, no husband present Map | 1,892 | 8,693 | 205,972 | 15,250,349 |
| Nonfamily households: Map | 2,349 | 13,918 | 345,502 | 39,177,996 |
| Householder living alone Map | 1,890 | 11,436 | 293,807 | 31,204,909 |
| Householder not living alone Map | 459 | 2,482 | 51,695 | 7,973,087 |
| HOUSEHOLDS, HISPANIC OR LATINO ORIGIN OF HOUSEHOLDER | ||||
| Not Hispanic or Latino householder: Map | 8,817 | 55,839 | 1,095,685 | 103,254,926 |
| Hispanic or Latino householder: Map | 514 | 1,909 | 20,083 | 13,461,366 |
| HOUSEHOLDS, RACE OF HOUSEHOLDER | ||||
| Householder who is White alone | 5,972 | 43,494 | 702,166 | 89,754,352 |
| Householder who is Black or African American alone | 2,855 | 11,998 | 383,797 | 14,129,983 |
| Householder who is American Indian and Alaska Native alone | 30 | 147 | 4,620 | 939,707 |
| Householder who is Asian alone | 83 | 549 | 7,676 | 4,632,164 |
| Householder who is Native Hawaiian and Other Pacific Islander alone | 4 | 30 | 363 | 143,932 |
| Householder who is Some Other Race alone | 255 | 1,017 | 9,252 | 4,916,427 |
| Householder who is Two or More Races | 132 | 513 | 7,894 | 2,199,727 |
| HOUSEHOLDS, HOUSEHOLD TYPE BY HOUSEHOLD SIZE | ||||
| Family households: Map | 6,982 | 43,830 | 770,266 | 77,538,296 |
| 2-person household Map | 2,257 | 16,193 | 315,384 | 31,882,616 |
| 3-person household Map | 1,791 | 10,918 | 188,229 | 17,765,829 |
| 4-person household Map | 1,555 | 9,575 | 148,008 | 15,214,075 |
| 5-person household Map | 793 | 4,479 | 72,179 | 7,411,997 |
| 6-person household Map | 343 | 1,682 | 27,612 | 3,026,278 |
| 7-or-more-person household Map | 243 | 983 | 18,854 | 2,237,501 |
| Nonfamily households: Map | 2,349 | 13,918 | 345,502 | 39,177,996 |
| 1-person household Map | 1,890 | 11,436 | 293,807 | 31,204,909 |
| 2-person household Map | 366 | 1,977 | 41,411 | 6,360,012 |
| 3-person household Map | 55 | 322 | 6,453 | 992,156 |
| 4-person household Map | 26 | 125 | 2,642 | 411,171 |
| 5-person household Map | 9 | 43 | 754 | 126,634 |
| 6-person household Map | 1 | 9 | 271 | 48,421 |
| 7-or-more-person household Map | 2 | 6 | 164 | 34,693 |
| HOUSING UNITS | ||||
| Total Housing Units Map | 10,048 | 61,634 | 1,274,719 | 131,704,730 |
| HOUSING UNITS, OCCUPANCY STATUS | ||||
| Occupied Map | 9,331 | 57,748 | 1,115,768 | 116,716,292 |
| Vacant Map | 717 | 3,886 | 158,951 | 14,988,438 |
| HOUSING UNITS, OCCUPIED, TENURE | ||||
| Owned with a mortgage or a loan Map | 5,414 | 35,201 | 454,408 | 52,979,430 |
| Owned free and clear Map | 1,166 | 8,664 | 322,665 | 23,006,644 |
| Renter occupied Map | 2,751 | 13,883 | 338,695 | 40,730,218 |
| HOUSING UNITS, VACANT, VACANCY STATUS | ||||
| For rent Map | 252 | 1,326 | 44,735 | 4,137,567 |
| Rented, not occupied Map | 8 | 56 | 1,920 | 206,825 |
| For sale only Map | 194 | 1,183 | 16,886 | 1,896,796 |
| Sold, not occupied Map | 22 | 125 | 4,915 | 421,032 |
| For seasonal, recreational, or occasional use Map | 53 | 271 | 28,867 | 4,649,298 |
| For migrant workers Map | 7 | 15 | 318 | 24,161 |
| Other vacant Map | 181 | 910 | 61,310 | 3,652,759 |
| HOUSING UNITS, OCCUPIED, AVERAGE HOUSEHOLD SIZE BY TENURE | ||||
| Total: Map | 2.89 | 2.78 | 2.58 | 2.58 |
| Owner occupied Map | 2.83 | 2.78 | 2.60 | 2.65 |
| Renter occupied Map | 3.02 | 2.79 | 2.53 | 2.44 |
| HOUSING UNITS, OCCUPIED, TENURE BY RACE OF HOUSEHOLDER | ||||
| Owner occupied: Map | 6,580 | 43,865 | 777,073 | 75,986,074 |
| Householder who is White alone Map | 4,572 | 35,378 | 544,576 | 63,446,275 |
| Householder who is Black or African American alone Map | 1,693 | 7,068 | 217,563 | 6,261,464 |
| Householder who is American Indian and Alaska Native alone Map | 20 | 100 | 2,977 | 509,588 |
| Householder who is Asian alone Map | 66 | 456 | 4,531 | 2,688,861 |
| Householder who is Native Hawaiian and Other Pacific Islander alone Map | 3 | 20 | 147 | 61,911 |
| Householder who is Some Other Race alone Map | 144 | 521 | 2,922 | 1,975,817 |
| Householder who is Two or More Races Map | 82 | 322 | 4,357 | 1,042,158 |
| Renter occupied: Map | 2,751 | 13,883 | 338,695 | 40,730,218 |
| Householder who is White alone Map | 1,400 | 8,116 | 157,590 | 26,308,077 |
| Householder who is Black or African American alone Map | 1,162 | 4,930 | 166,234 | 7,868,519 |
| Householder who is American Indian and Alaska Native alone Map | 10 | 47 | 1,643 | 430,119 |
| Householder who is Asian alone Map | 17 | 93 | 3,145 | 1,943,303 |
| Householder who is Native Hawaiian and Other Pacific Islander alone Map | 1 | 10 | 216 | 82,021 |
| Householder who is Some Other Race alone Map | 111 | 496 | 6,330 | 2,940,610 |
| Householder who is Two or More Races Map | 50 | 191 | 3,537 | 1,157,569 |
| HOUSING UNITS, OCCUPIED, TENURE BY HISPANIC OR LATINO ORIGIN OF HOUSEHOLDER | ||||
| Owner occupied: Map | 6,580 | 43,865 | 777,073 | 75,986,074 |
| Not Hispanic or Latino householder Map | 6,263 | 42,776 | 768,762 | 69,617,625 |
| Hispanic or Latino householder Map | 317 | 1,089 | 8,311 | 6,368,449 |
| Renter occupied: Map | 2,751 | 13,883 | 338,695 | 40,730,218 |
| Not Hispanic or Latino householder Map | 2,554 | 13,063 | 326,923 | 33,637,301 |
| Hispanic or Latino householder Map | 197 | 820 | 11,772 | 7,092,917 |
| HOUSING UNITS, OCCUPIED, TENURE BY HOUSEHOLD SIZE | ||||
| Owner occupied: Map | 6,580 | 43,865 | 777,073 | 75,986,074 |
| 1-person household Map | 1,274 | 7,736 | 179,249 | 16,453,569 |
| 2-person household Map | 2,038 | 14,857 | 273,683 | 27,618,605 |
| 3-person household Map | 1,285 | 8,648 | 136,888 | 12,517,563 |
| 4-person household Map | 1,069 | 7,464 | 107,309 | 10,998,793 |
| 5-person household Map | 556 | 3,324 | 49,858 | 5,057,765 |
| 6-person household Map | 217 | 1,189 | 18,207 | 1,965,796 |
| 7-or-more-person household Map | 141 | 647 | 11,879 | 1,373,983 |
| Renter occupied: Map | 2,751 | 13,883 | 338,695 | 40,730,218 |
| 1-person household Map | 616 | 3,700 | 114,558 | 14,751,340 |
| 2-person household Map | 585 | 3,313 | 83,112 | 10,624,023 |
| 3-person household Map | 561 | 2,592 | 57,794 | 6,240,422 |
| 4-person household Map | 512 | 2,236 | 43,341 | 4,626,453 |
| 5-person household Map | 246 | 1,198 | 23,075 | 2,480,866 |
| 6-person household Map | 127 | 502 | 9,676 | 1,108,903 |
| 7-or-more-person household Map | 104 | 342 | 7,139 | 898,211 |
Loading...